 Symbi Biological
Recently, a group of our awesome interns and one curious horse named Boomer joined me in the field to do some soil sampling. Our focus at TomKat Ranch is providing healthy foods on working lands in a way that sustains the planet and inspires others to action. Healthy soil has everything to do with healthy food. Soil monitoring is an important part of knowing if we are providing the best possible forage for our cattle. Healthy pasture plants means more ground cover (more plants) sending root exudates, which are food for microbes, into the ground increasing organic matter to actually grow soil. Yes, soil really does grow! As the soil organic matter is produced, there is more “room” to store nutrients for the plants to grow providing nutrient dense forage for the cattle. The reward being that a thriving pasture will sequester carbon in the soil simply through photosynthesis and well managed grazing.
Our on site ecologist team, led by Mel Preston of Point Blue Conservation Science and the Rangeland Monitoring Network already does yearly monitoring for us measuring specifically bulk density, organic carbon, water infiltration, and plant and bird diversity and abundance. This approach allows the RMN to link many different ranches around California providing a lot of data over a large number of ranches in an economical way. Making the testing easy and cost effective, the idea is to be able to get as many ranchers to participate as possible. A big thanks to RMN for loaning us some equipment and sampling protocol so that we can keep consistent with their highly appreciated work. You can see the data on our TKREF website.
Our purpose for going out in the field was to give our interns experience in soil sampling with full elemental analysis of the soil plus biological testing using PLFA and Haney Tests. PLFA stands for phospholipid fatty acid and gives us an account of the soil community and it’s abundance by analyzing phospholipid fatty acids that help identify certain groups by testing for their PLFA biomarkers. The Haney Test measures the microbial respiration and the organic extractable carbon and nitrogen, which is a fancy way of saying it measures how much the microbes breathe and how much food they have down there. Basically, it gives us an idea of how many good guys are hanging out at the party and how much beer and pizza they have to keep it going.
While costing a little extra, conducting tests more than once a year gives us a better understanding of our management practices and whether or not they are having the desired effect. If we do happen to increase our water holding capacity as expected through planned grazing, we could see a response in the soil biology as a result giving us valuable feedback.
Gaining an insight on how our soils are balanced and the biological activity will help inform the Land and Livestock Team to make the right decisions in managing the herd. We will begin sampling this summer and continue with the full regimen when the RMN crew does their annual sampling later this year.
See below for soil sampling protocol:
TomKat Ranch Educational Foundation – Soil Sampling Protocol
Summer 2016
- Methods
Modified from protocol in Porzig et al (2016), Rangeland Monitoring Network Handbook to include deep soil and phospholipid fatty acid sampling. Following describes our protocol as different from RMN.
At each pasture, soil sampling will occur within a 50m radius of point count locations. At each point count location identified for soil data collection, initial sampling sites will be randomly identified and 5 bare ground assessments, 5 water infiltration, 5 bulk densities, 5 shallow (0-10cm, 10-40cm) soil cores and 5 deep (100cm) soil cores will be taken. 15 additional shallow soil cores will be taken at each point count location to ensure enough sample volume for biological and chemical analysis. Soil cores will be bulked, mixed, and resampled on-site such that 1 sample will result from each location but it will represent an aggregate of the area within 50 m of the sample location (Porzig et al 2016).
Locating Points
- Before going into the field, upload coordinates of pastures to be sampled onto handheld GPS tool.
- Using online website (https://www.random.org), generate a list of 20+ random angles (between 0° and 360°) and distances (between 0 and 50 meters).
- In the field, use GPS tool to locate center point of the 50m sampling radius.
- Using list of random angles and distances, locate 5 subsampling locations with help of compass and feet. If the point is unsuitable (e.g., due to large boulders, etc), select a new sampling point. Record the site number (1 through 5) on the data sheet.
Bare Ground & Litter Depth (from RMN Handbook)
- At each of the 5 initial sites, lay the quadrant grid flat on the ground. Looking directly down at the grid, count the number of intersections of string that overlay bare ground. Record this number on the data sheet.
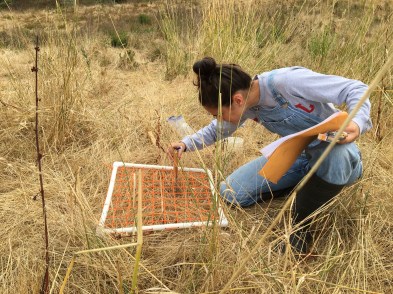
- At each site, measure the depth of litter at 3-5 locations within the bare ground sampling grid and record the average of these measurements. Litter is dead plant material that is more or less lying on the ground; standing straw is not included; thatch that is lying on the ground and acting as litter should be included.
- Water Infiltration (from RMN Handbook)
- At each of the 5 initial sites, clear litter from the surface of the soil.
- Insert the 15.2 cm diameter ring ~5 cm into the ground. Be careful to apply even pressure. Use wooden block and hand sledge if necessary.
- Lay plastic sheet inside ring covering inner walls and extending out of the ring.
- Pour 2.5 cm water (450 mL for a 15.2 diameter ring) into ring, on top of plastic wrap.
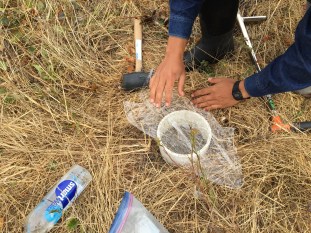
- Carefully and quickly remove plastic wrap, making sure all water remains within the ring and start timer.
- Wait until approximately 95% of the water has sunk into the soil; record end time. If infiltration is slow, it can be difficult to be confident of the exact time to stop the timer. 5% of 450 mL is 22.5 mL. You can measure this amount out in a graduated cylinder in the lab to improve your estimate of the finishing time.
- Reinsert plastic sheet and repeat application of 2.5 cm water.
- Remove plastic sheet again and record start time.
- Record end time when 95% of water has filtered into the ground.
- Repeat once more, for a total of 3 water infiltration times.
If infiltration is very slow such that there is still water in the ring after 45 min, stop the timer at 45 min and measure the height of the remaining water. Extrapolate the infiltration time using the protocol below. Record the extrapolated time, and document in the notes field.
- Stop the clock at 45 min, and measure the depth of the remaining water.
- Calculate how much water has infiltrated in 45 min: Water Infiltrated = Total Water (2.5 cm) – Water Remaining
- Calculate the volume of the water infiltrated using:
Volume = π r2 * h
Where π = 3.14, r = radius of the ring (7.6 cm) and h is the height of the water that has infiltrated.
Using this equation, cross multiply to solve for Extrapolated Time. Round to the nearest whole minute.
Extrapolated time = 45min * 450 mL
Volume infiltrated
Bulk Density (from RMN Handbook)
In the field:
- At each of the 5 initial sites, identify bulk density sampling point, within 1 m of water infiltration location.
- Remove vegetation, loose litter and duff, being careful not to remove surface soil, or disturb soil crust.
- Insert ring (5.1 cm diameter, 7.5 cm high) until top of ring is level with surface. Be careful to apply even pressure. Use wooden block and hand sledge if necessary.
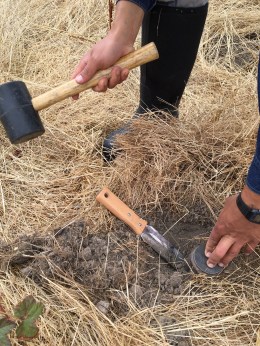
- Excavate ring, using trowel. Lift ring out using trowel underneath it to ensure no loss of soil.
- Use flat blade knife to level soil with bottom of ring.
- Place soil in sampling bag and label with the ranch code, point count location, the sampling site number, and date.
- Leave bags open to air dry.
In the lab:
*Note: did not take wet weights and did not remove rocks or grind soil because no rocks, soil very dry, not necessary.
- Transfer each subsample from bags into labeled tins.
- Place tins in oven to dry for 24-36 hours at ~260°F. Be extremely careful that samples do not start to burn.
- Weigh dried samples to the nearest 0.1 gram.
- Bulk Density (g/cm3) = oven dry weight of soil/ volume of bulk density ring
- Shallow Core Sampling
- At each point, remove vegetation, litter, and duff, to mineral soil, being careful to not remove the surface soil, or disturb soil crust.
- Using soil probe, take soil core to 40cm. Mark soil probe using sharpie to
 distinguish between depth layers: surface (0-10cm) and deeper (10-40cm soil). You may need to retrieve additional surface (0-10cm) soil by hand using trowel.
 - Using butter knife, divide contents of each core sample into 2 buckets labeled 0-10cm and 10-40cm.
- Because ultimately you will need at least ½ quart bag soil for all biological (PLFA) and chemical analyses to be done, repeat this process at 20 random sites within the point count location. For each of the two depths, all subsamples from the 20 sites should be bulked and mixed together and sample will be taken from the composited subsamples.
- Bag the composite sample from each depth and label each with the date, ranch code, point count location, core depth, and number of sampling points. Each bag should have soils from 20 sites.
- Deep Core Sampling
- At the original 5 random sites, use AMS Professional Soil Sampling Kit tools to excavate soil sample from 100cm deep.
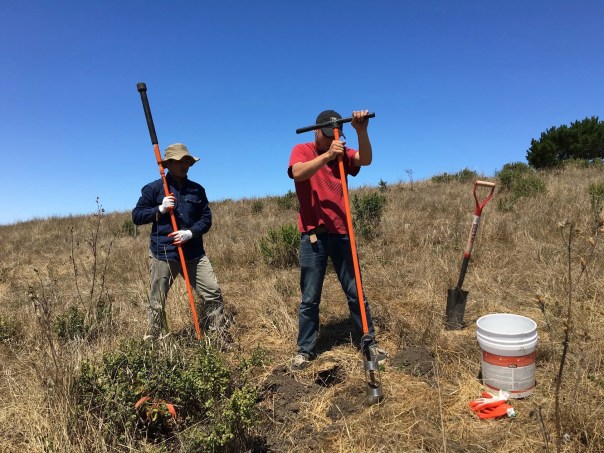
- Transfer this soil into appropriately labeled bucket.
- All subsamples from the 5 sites should be bulked and mixed together and sample will be taken from the composited subsample.
- Bag the composite sample and label with date, ranch code, point count location, core depth and number of sampling points. Each bag should have soils from 5 sites.
- At the original 5 random sites, use AMS Professional Soil Sampling Kit tools to excavate soil sample from 100cm deep.
Sample Storage
- Immediately after finishing site sampling, place the 0-10cm composite sample into labeled and sealed ziplock bag and store in freezer if samples are taken at different times as this sample will be later tested for biological activity (Ward Laboratories, Inc.). If samples are taken at the same time, it is best if samples are kept as close to the original soil temperature. Ship in cooler, ideally.
- For all other soil samples (bulk densities, 10-40cm and 100cm samples) transfer soil into labeled ziplock bags to be stored open, in cool dark place.
Sample Analysis
- Using Ward Labs website for shipment instructions, ship samples to Ward Labs in Nebraska for the following soil tests:
- 0-10cm composite samples: Complete, Haney, PLFA
- 10-40cm composite samples: Complete, Haney
- 100cm composite samples: Complete, Haney
Ward Laboratories Inc, 4007 Cherry Avenue, Kearney, NE 68848
References:
Donovan, P. 2013. Measuring Soil Carbon Change: a practical, flexible, local method. http://soilcarboncoalition.org/files/MeasuringSoilCarbonChange.pdf
NRCS. 1999. Soil Quality Test Kit. USDA. http://www.nrcs.usda.gov/Internet/FSE_DOCUMENTS/stelprdb1044790.pdf
Porzig, E., N.E. Seavy, R. T. DiGaudio, C. Henneman, and T. Gardali. 2016. The Rangeland Monitoring Network Handbook V1.0. Point Blue Conservation Science, Petaluma, California. http://www.pointblue.org/uploads/assets/admin/RMN_Handbook_Jan_2016.pdf
Ward Laboratories, Inc. Biotesting Sampling Info. Kearney, Nebraska. http://www.wardlab.com/WardInfo/BiotestingSamplingInfo.aspx

Pingback: TomKat Ranch Educational Foundation – Soil Sampling at TKREF